Foretell is introducing two new question formats for indefinitely active time series-based and binary questions. The time series-based format (rolling multi-window) elicits a point estimate and 80% prediction interval over multiple time periods. The binary format (rolling risk) elicits a single probability of an event over a set time period, such as six months. Both formats will continually roll over in time.
We expect these formats will be superior to their alternatives for a subset of question types: those designed to measure a continually present feature of the world—e.g., U.S.-China trade levels or the chance of a shooting conflict in the South China Sea—rather than the likelihood of an event specific to a definite time period—e.g., which party will win the 2022 congressional election. The former question type is particularly useful when forecast questions are used as metrics to inform broader scenarios. For that reason, Foretell issue campaigns will nearly exclusively be based on these new question formats.
Rolling risk format
Problems with the alternative format
The rolling risk format is for binary questions, broadly of the form will X happen by Y. Such questions are typically asked in reference to a set date, which approaches over the lifetime of the question. An example from Foretell is Will the Chinese military or other maritime security forces fire upon another country’s civil or military vessel in the South China Sea by September 30, 2020?
In the above example, the September 30, 2020 date is arbitrary; what we wanted to measure was the general risk level. When this is the case, the above question format has two problems. First, the crowd’s forecasts should change over time, as the end-date approaches. As a result, a forecast can only be meaningfully understood by reference to when it was made. For example, a 10% forecast of a shooting conflict by September 30 means something very different if it’s made on July 1—with three months remaining of the forecast period—than it does if it’s made on September 15—with two weeks remaining. For the same reason, aggregating the forecasts to generate a crowd consensus is not straightforward, as forecasts made on different dates must be treated differently.
The first drawback can be addressed by asking about the probability of an event between two future dates. An example from Foretell is Will the Chinese military or other maritime security forces fire upon another country's civil or military vessel in the South China Sea between September 1, 2021 and February 28, 2022, inclusive?, which closes on August 31, 2021. Because this question measures risk over a set six-month period, all forecasts are comparable and can straightforwardly be aggregated to generate a crowd consensus. In addition, if we ask the same question over a different six-month period, we can make an apples-to-apples comparison of risk level over time.
The above solution is subject to a second problem with this question format: to measure risk level over time, we have to continually re-issue the question. Indeed, Foretell is currently on its fourth version of this question. Re-issuing questions is a clunky solution, as it asks forecasters to view the question afresh, without convenient access to the forecasts from the previous questions.
Our solution
The new rolling risk format addresses these problems by using a single parent question that asks about the risk over a set length of time, such as Will the Chinese military or other maritime security forces fire upon another country's civil or military vessel in the South China Sea in the next six months? For this example, the six-month period always begins with the following month; at the end of the month, it functionally becomes a new question.
How the forecasting interface works
The forecasting interface for these questions is the same as it is for all other binary questions. Users simply provide their probability estimate that the outcome will occur in the specified time period (e.g., next six months).
How scoring works
To see how scoring works, consider the above example about the chance of a shooting conflict in the South China Sea. In addition to a specified forecast window (six months), these questions also have a specified scoring frequency (monthly in this example), which determines how often scores are generated for the question.
Figure 1 shows how this question is scored if the event does not occur. Forecasts made in month 1 cover months 2-7. At the end of month 7, forecasts made in month 1 are scored; at the end of month 8, forecasts made in month 2 are scored; and so on.
If the event does occur, all forecasts made in the previous six month-long periods are scored at once. For example, if the event occurs for the first time in the middle of month 9, as illustrated in Figure 2, forecasts made in months 3-8 will be resolved positively, and forecasts made in months 1-2 will be resolved negatively.
The parent question will display the history of scored periods and information about upcoming scoring. As shown in Figure 3, the scored periods section will display the scores for each resolved period as well as the question’s consensus forecast for the associated forecast window.
Figure 3
The scored questions will also provide detailed information about the period scored and will link to the parent question, as shown in Figure 4.
Rolling multi-window format
Problems with alternative format
The rolling multi-window format is for time series-based questions, broadly of the form how much of X will happen by Y, where we have historical data for X. Such questions typically elicit probabilities for pre-set outcome ranges, often referred to as “bins,” for a single future date. An example from Foretell is How much funding will U.S. tech startups raise between July 1 and December 31, 2021? Figure 5 shows the forecast bins and a graphic displaying the consensus crowd forecast (red), contrasted with the historical data (blue).
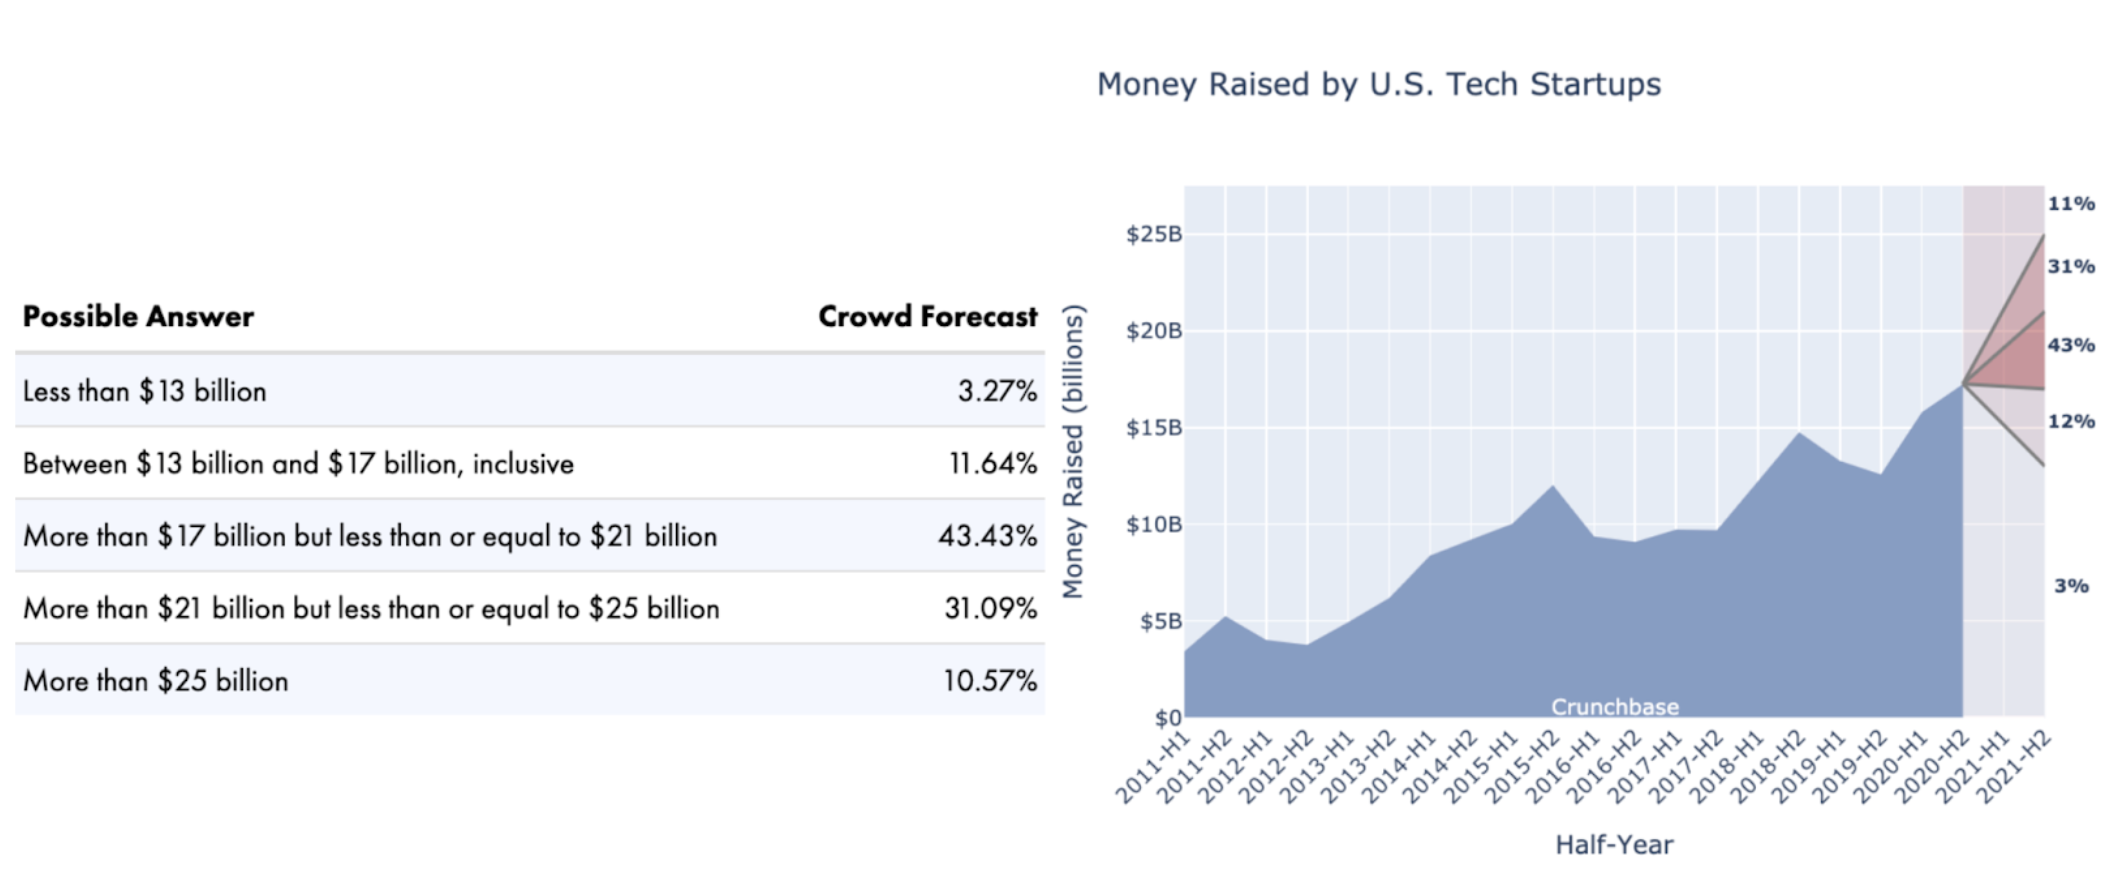
Figure 5
The first problem with the above format is the use of bins. Some evidence suggests the use of bins can bias forecasters. More critically, if the bins are chosen poorly, the majority of forecasts might fall within a single bin, providing very little forecast granularity. Further, from the perspective of forecast consumers—the policymakers and analysts we want to inform—bins are an unfamiliar way to view the consensus crowd forecast. In our experience, end users would prefer to see a point estimate, meaning the value for which the outcome has an equal chance of being above and below, surrounded by a prediction interval. A prediction interval is a measure of uncertainty. For example, an 80% prediction interval provides a range of values that is expected to include the actual value 80% of the time.
The second problem with this format is that the forecast covers only a single time period, the second half of 2021 in the above example. A quarter-by-quarter forecast covering multiple years would be more useful. We could address this problem by publishing multiple versions of the same question, each asking about different time periods, but that solution is clunky for many of the same reasons discussed above regarding the binary format.
Our solution
The rolling multi-window format addresses these problems by using a single parent question that elicits the 50% point estimate and 80% prediction interval (10% and 90% forecasts) over multiple time periods. Consider the example How will money raised by U.S. tech startups change over the next three years? We could ask this as a series of six separate questions—i.e., How much funding will U.S. tech startups raise in 2021 H1? In 2021 H2? In 2022 H1? And so on—but the new format allows us to ask this as a single question with a series of sub-questions, one for each six-month period:
Each of these questions will have a certain number of time periods active for forecasting at any given time. In the example above, we’re forecasting six time periods at a time. When one of these time periods ends (at the end of a half-year in this example), that time period will automatically close and the next one will automatically open for forecasting.
How the forecasting interface works
As discussed above, in the past, time series-based questions have required users to enter a probability for each answer “bin,” representing a range of possible outcomes. In addition to the problems with bins discussed above, they’re particularly ill-suited to the multi-time window format.
To facilitate a more intuitive, user-friendly forecasting experience, we designed an alternative forecasting interface. As illustrated in Figure 7, to make a forecast, users drag three lines across the forecast periods, with each dot representing a different forecast. The middle line is for the 50% point estimate: the value for which forecasters believe the actual outcome is equally likely to be above or below. The top line is the upper end of the 80% prediction interval: the value for which forecasters believe there’s a 90% chance the actual outcome will be below and a 10% chance it will be above. The bottom line is the lower end of the 80% prediction interval: the value for which forecasters believe there’s a 10% chance the actual outcome will be below and a 90% chance it will be above. For any time period where the forecaster adjusts none of the dots, it will be assumed to indicate “I don’t know,” and no forecast will be stored.
Figure 7
How scoring works
To generate a Brier score for these forecasts, the system fits a skew normal distribution to the inputted forecast points. From there, we derive a probability density function and use that to generate binned probabilistic forecasts, which can then be scored in the same way the bin-based questions are scored. The binned forecasts can then be aggregated across all users and re-converted into the same point estimate/prediction interval format used to make the forecasts. Because each time period is effectively a different question, new Brier scores will be generated for each forecasted time period.
* * *
We encourage anyone interested in these new question formats to explore their use in our new issue campaign on the future of the DoD-Silicon Valley relationship (active questions here). Please email us with suggestions for how we can improve them.